Posts

Showing posts from August 21, 2017

Business Intelligence SEO Youtube Bears Snakes Oh My

Image
Learning Business Intelligence, SEO, Youtube, Bears, Snakes, Drakes Latest Album.  I talk about all of that and some. I've recently released a lot of Tableau related content, SEO related content, and if you're into business intelligence consulting or looking to get into business intelligence consulting ... Maybe some SEO ? Maybe you're just looking for new ideas to get your mind sparking. Or you want to dominate the ranking game? Below are related links to our Blogger blog here! Please go through them on at a time, and check out the dashboards embedded, screenshots, and explanations of what's happening. Soon I will be doing a lot more videos to correspond with the content. It's an exciting time to push this stuff into the public and thanks for keeping track! What to see a multi million dollar company illegally spamming links to rank on Google? Things you must know in business intelligence - Building dashboards in Tableau desktop A true awe

My Ugly Ass Dashboard - Hey It was Pretty Cool though...

Image
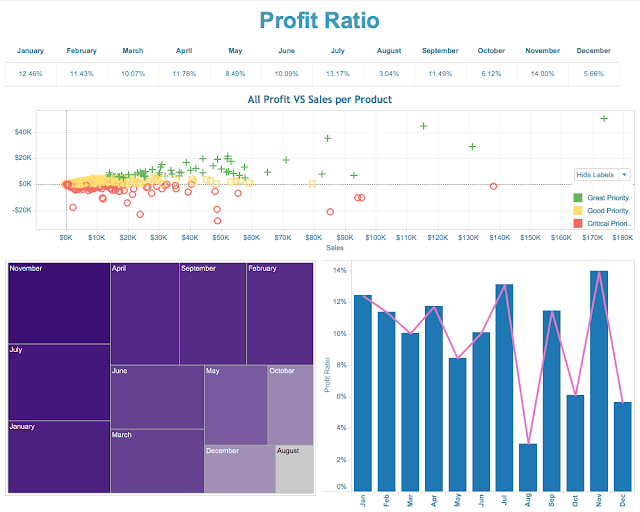
Come check my profile out on Tableau public.  I founded a lot of cool practices in Tableau . Lets dive in. This is ugly. Wow. My ugly ass dashboard is not winning anyone's heart. Not the best thing to look at. I should have followed some color palette best practices.  More than 7, you're going to lose your audience. And if they don't blend, it looks like poo. Remember though, I made this dashboard in a single session at a coffee shop. No product to date can accomplish this task. Tableau rocks . Ugly ass dashboards in 2017 Don't do it! Avoid the urge to make that ugly fuggly thing. Make beautiful dashboards, and also don't forget to go search my name at Tableau Public. I've got dashboards that have been views nearly 10k times and they are 100% educational. I wrote the book on best practices back in the day.  Need help with  Tableau Ping me!

The true Awesome Dashboard, that started my blog idea

Image
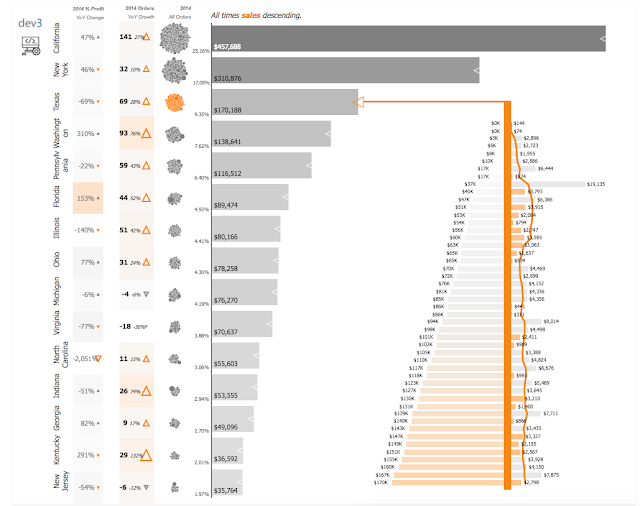
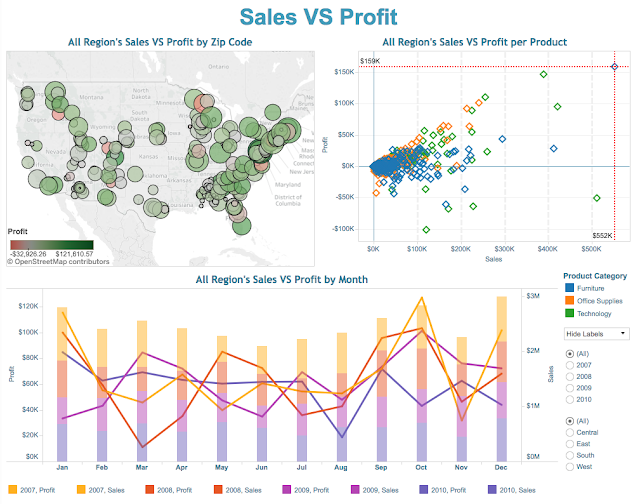
Here's my favorite awesome dashboard.  I do Tableau consulting at Dev3lop.com Yes, if you're looking at this and thinking, ' damn that's awesome .' That's the goal, is to make amazing dashboards because I've been doing design for 14+ years. In this awesome dashboard i don't even touch photoshop! Originally at https://dev3lop.com/awesome-dashboard/ Learning logical functions in Tableau. When someone says if, else, then, are you lost? Well check out this tableau public dashboard . 

Everyone Will Use Me Dashboard

Image
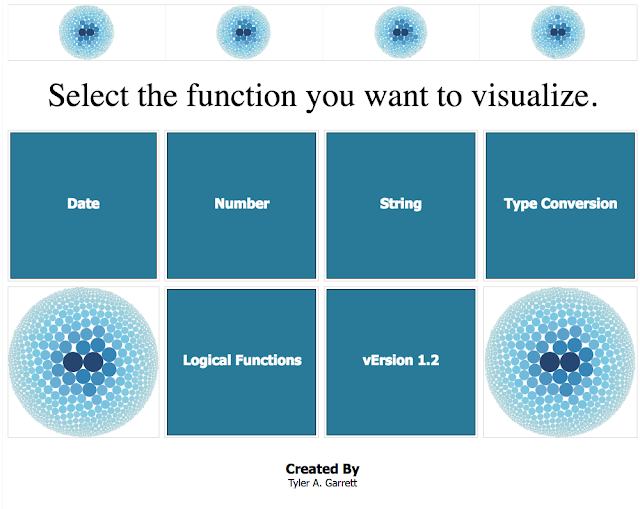
Hey I built a dashboard that a junior consultant told me would be too much work. I explained to him this would be powerful because everyone needs help understanding this VS using the ONLINE HELP. I submitted the ball charts to a community as art. Everyone will use me dashboard by Dev3lop Now it's almost at 10k views and one of the most popular dashboards in the public community . I thought I broke something. They went down. I was worried.

Trend line - line chart in tableau desktop polynomial

Image
I was worried I couldn't capture  my  experiences. Blogger is the best thing for keep tracking of this growth.  Tableau Developer  - Hello, Tyler Garrett, Founder of  dev3lop.com/t Trend Line's be in Line chart in Tableau Desktop Is so cool, it's a line chart, it's got super curvy octive level usage of stuff! I snuck in this crazy chart into my tableau interview back in the v8.1 days.  Tableau desktop polynomial is a big blurb of bleep bloops and 'flooptdy doops.'  If you took statistics in College, Like I did, the teacher wrote the book.  So I can get past everyone using this and no one asks. That's because they don't know what a trend line does when we are speaking of polynomial degrees.  They don't teach that in art class. Polynomial Degree's Do you know them? And use trendlines? Nice! /kowtow. You don't need to be an expert, just Google it before you show it to the executives or people interviewing you.

Really awesome dashboard - Stacked Bars tableau desktop.

Image
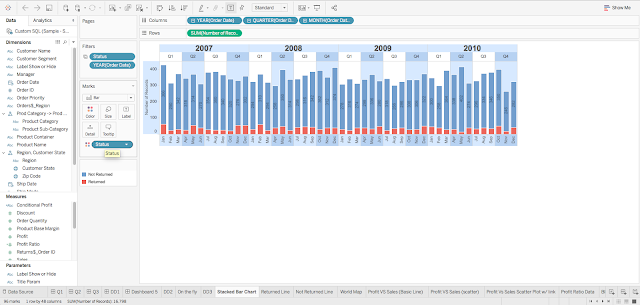
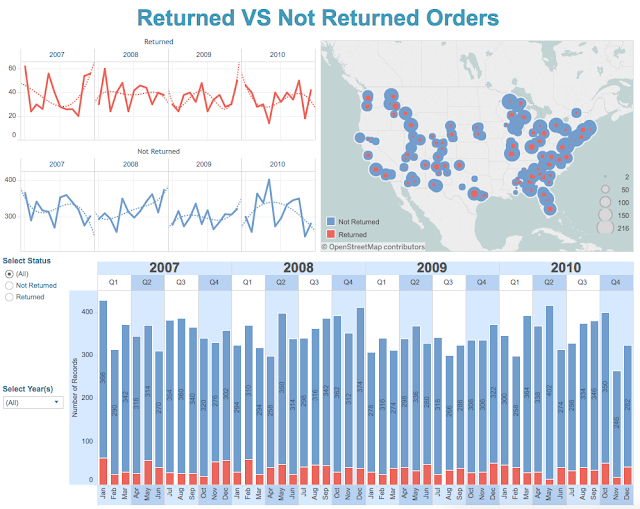
Hello Need a really awesome dashboard ? HEY THERE, it's tyler. Get your stacked bar chart here! Yes Stacked Bar Charts are AMAZING ! This landed me the job at tableau software. Check me out on Tableau public.  A Really Awesome Dashboard - Stacked Bar Chart. Yes, please. Really awesome dashboards are what the executives want to see. The dashboard resides here. Learn about Short links from this tableau expert.

Awesome Dashboard!! My first time using Tableau desktop 2 of 8

Image
Hey again, Tyler here . My Tableau profile. My first time showing off my dashboarding skills was in Austin, TX. https://dev3lop.com/awesome-dashboard/ I just came from doing a 3 week ETL engagement, which I was able to turn into 5 weeks because 'I really love Austin, TX' That's all she wrote! 5 weeks later I have a job offer, and after crushing SAP BOBJ with ArthorCare. Which is now Bought up by another 'surgical tool company' What a cool engagement, we were debugging all kinds of fun stuff in their ETL environment. After we got past that - we started working with Mark, who ended up being the first person I told my kid about - when I first found out my wife was pregnant with Andoni our son. Mark wanted access to his data, and just wanted something easy. We worked with him for a week, got everything we needed, worked with an ETL professional who works with Dell - and he and I mapped it all out, Mark was able to have his job automated, it was a kickass

For my Interview at Tableau Software 1 of 8 Dashboards

Image
Yes, you heard that right. The first time I did Tableau in front of people... It was this dashboard! I was at the Tableau Software Headquarters in Austin, TX. The dashboard was pretty cool for my first time really diving into dashboarding to answer questions. I learned a lot about storytelling over at Tableau - and this was built back in v8.0 too. I love how it still opens just fine in Tableau Public. What a great product. I love this one, I even did a hide to hide labels.

Sideways Sorted Bar Charts in Tableau Desktop

Image
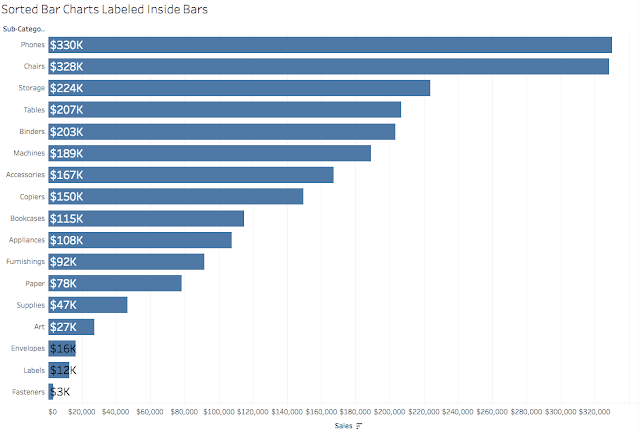
Hey there! It's Tyler from Dev3 . I'm here to show you some more Tableau Desktop bar charts. There are so many ways to slice this tomato open, and hopefully, all of these will get your brain thinking about what's the next best thing you could build - besides the usual default formatting. Here I demonstrate being able to click on a dimension parent, click SORT, and boom - you can sort that entire segment of dimensions. Not something they teach you when you first start! A little under the hood awesomeness thanks to the developers of Tableau Software. We made lots of great charts for your viewing pleasure . Tableau desktop is extremely lean and effective. I love how crisp and sharp the image is. Be sure to check out the other dashboards I've generated in Tableau Desktop and published for your consumption on Tableau Public!

Tableau Desktop Label your Bars on the Inside

Image
Hello, Dev3lop here, Tableau Consulting Pro ! Label your bars on the inside of the bar with a simple alignment change in your Text mark card on Tableau desktop . Sorted bar charts labeled inside bars. This is a bread and butter unless your client doesn't like the swapping of automatic colors. I'd go heavy on the Tableau desktop transparency on the mark color setting. This will enable you to FIX the Label color if necessary. Want to see a map in Tableau desktop? How about a map with 100% of my professional service engagement touches ? I love showing how I've worked around the globe, to ensure clients they can trust I will be able to help them beyond other Tableau consulting vendors. My future blog ideas are, if anyone wants to write one of these, please comment the # below and leave your email. visualization exercises visualization data visualization techniques visualization meditation visualization quotes visualization or visualisation visua

Really rad labels in Tableau desktop and I love Tableau Software

Image
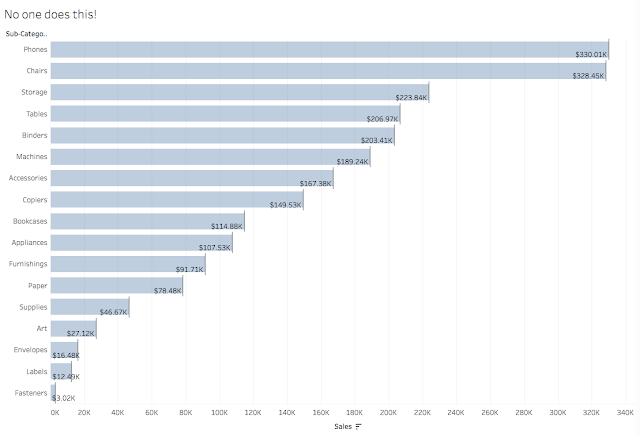
Hey Dev3lop here, a great Labeling method I use here! https://public.tableau.com/profile/tyler.garrett#!/vizhome/FreelanceTableauConsultantSortedBarChartsLabelInsideTopofBar/Noonedoesthis It's one of my favorite ways to label the bar because no one ever does a reference line and then right-click edit format! It's pretty hard to click, there's a 4pixel either direction variance at one point until I showed the Tableau product manager - and actually used paint to draw the pixels, saying it was WAY 2 hard. Now I believe it has a bit more padding. The developer and product management team are so great. Everything I've ever brought up while working there was fixed the next update. Except buttons being native. That's still a thing. I designed, mocked up the Start and End being fixed on both sides, and boom next update it was there. Regardless if it was already in their mind, I sent that to the product manager executive TomW and we chatted about how much of

Beautiful Dashboard Examples by Tableau Expert

Image
More awesome Tableau Consulting flexing over on Tableau Public. I made this to show people another great way to build dashboards in tableau. #1 be sure to change transparency of your marks to a lighter color, almost everyone prefers it in every engagement I've been lucky enough to have over the past many years! Beautiful Dashboard Examples by Tableau Expert Beautiful dashboards, awesome dashboards, whatever your pleasure, just make it different. People will point out the greatness in your work if there is greatness to be had. A few extra clicks will turn your dashboard into something people will want to use again. Side note: Did you know there is a thing called  short links ? https://goo.gl/eXvRBw This one, for example, comes from Goo.gl Here's the recap of all the blogs we built https://tylerdev3.blogspot.com/2017/08/thanks-for-all-views-and-follows.html Here's the recap of everything I've blogged about recently here on blogger! I r