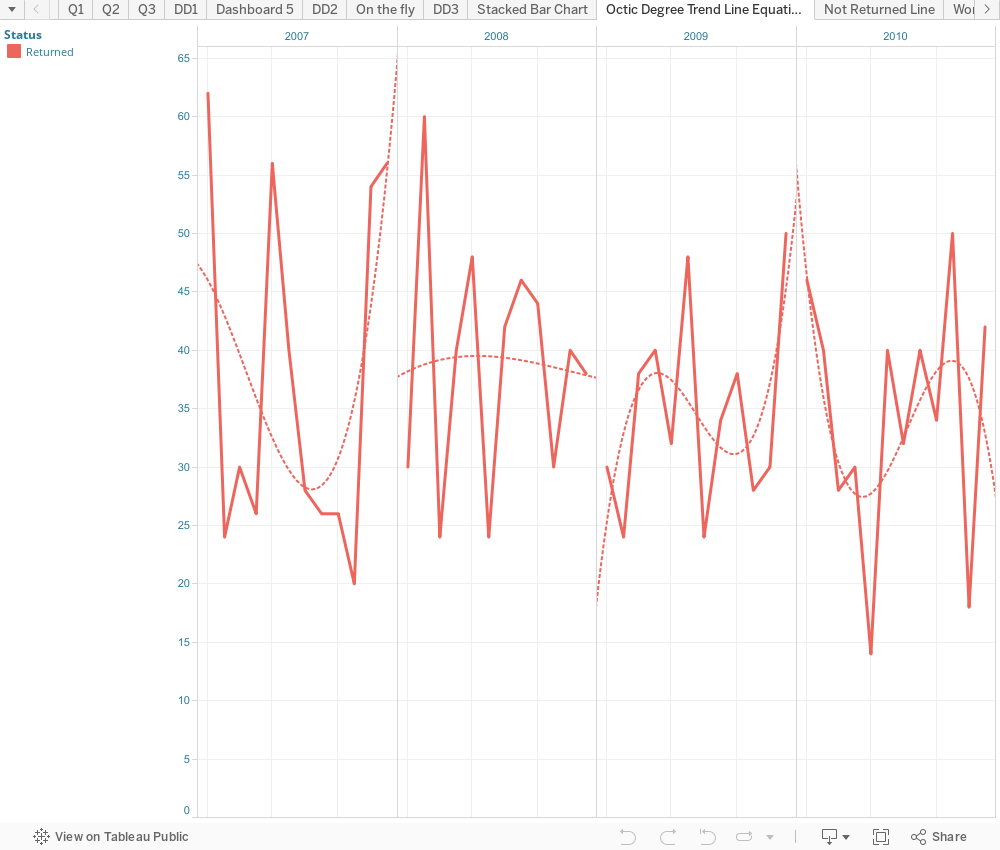
Trend line - line chart in tableau desktop polynomial
I was worried I couldn't capture my experiences. Blogger is the best thing for keep tracking of this growth. Tableau Developer - Hello, Tyler Garrett, Founder of dev3lop.com/t
Trend Line's be in Line chart in Tableau Desktop
Is so cool, it's a line chart, it's got super curvy octive level usage of stuff!
I snuck in this crazy chart into my tableau interview back in the v8.1 days.
I snuck in this crazy chart into my tableau interview back in the v8.1 days.
Tableau desktop polynomial is a big blurb of bleep bloops and 'flooptdy doops.'
If you took statistics in College, Like I did, the teacher wrote the book.
So I can get past everyone using this and no one asks.
That's because they don't know what a trend line does when we are speaking of polynomial degrees.
They don't teach that in art class. Polynomial Degree's
Do you know them? And use trendlines? Nice!
/kowtow. You don't need to be an expert, just Google it before you show it to the executives or people interviewing you.

Used this to land my job at tableau software. No one asked me what these lines were!
Well if you highlight you will see it's to the power of 8.

Bleep bloop native highlight awesome, to the power of awesome. or eight. octic power. Woot. i love you too.
Probably going to want to look up polynomial.
What the f*** anomial. Don't use trend lines - Polynomial - unless you know what it means!

What's interesting to me is I threw this in there to see if anyone would catch it. Having come from a heavy data background and working with big data with companies around the world... I went to college for this!
I had to throw this in there. No one caught it.
No one asked me why I used the polynomial of the octic degree.
Not a light read, but if you find yourself using it and someone isn't asking - chances are they probably don't know what it's about.

Octic equation


where a ≠ 0.
An octic function is a function of the form

where a ≠ 0. In other words, it is a polynomial of degree eight. If a = 0, then it is a septic function(b ≠ 0), sextic function (b = 0, c ≠ 0), etc.
The equation may be obtained from the function by setting f(x) = 0.
The coefficients a, b, c, d, e, f, g, h, k may be either integers, rational numbers, real numbers, complex numbers or, more generally, members of any field.
Since an octic function is defined by a polynomial with an even degree, it has the same infinite limit when the argument goes to positive or negative infinity. If the leading coefficient a is positive, then the function increases to positive infinity at both sides; and thus the function has a global minimum. Likewise, if a is negative, the octic function decreases to negative infinity and has a global maximum. The derivative of an octic function is a septic function.
Peak at my blogs here:
Peak at my blogs here:
|
More on Names of polynomials.

You're weird. :)
|

A chance to throw in a big wizardy gotcha in my interview was a means of interviewing the room too.
It was a fun process.
Trend line - Line Chart - Tableau Desktop Rock and Roll
You want to do a trend line in your line chart in Tableau desktop, well you want to learn this stuff first! Grabbed it from wiki, I went to college and leared this but you can use this just the same!
Names of polynomials by degree[edit]
| Look up Appendix:English polynomial degrees in Wiktionary, the free dictionary. |
- Special case – zero (see § Degree of the zero polynomial below)
- Degree 0 – constant[4]
- Degree 1 – linear
- Degree 2 – quadratic
- Degree 3 – cubic
- Degree 4 – quartic (or, if all terms have even degree, biquadratic)
- Degree 5 – quintic
- Degree 6 – sextic (or, less commonly, hexic)
- Degree 7 – septic (or, less commonly, heptic)
For higher degrees, names have sometimes been proposed,[5] but they are rarely used:
- Degree 8 – octic
- Degree 9 – nonic
- Degree 10 – decic
Names for degree above three are based on Latin ordinal numbers, and end in -ic. This should be distinguished from the names used for the number of variables, the arity, which are based on Latin distributive numbers, and end in -ary. For example, a degree two polynomial in two variables, such as , is called a "binary quadratic": binary due to two variables, quadratic due to degree two.[a] There are also names for the number of terms, which are also based on Latin distributive numbers, ending in -nomial; the common ones are monomial, binomial, and (less commonly) trinomial; thus is a "binary quadratic binomial".


Other examples[edit]
- The polynomial is a nonic polynomial
- The polynomial is a cubic polynomial
- The polynomial is a quintic polynomial (as the are cancelled out)


The canonical forms of the three examples above are:
- for , after reordering, ;
- for , after multiplying out and collecting terms of the same degree, ;
- for , in which the two terms of degree 8 cancel, .


Behavior under polynomial operations[edit]
The degree of the sum, the product or the composition of two polynomials is strongly related to the degree of the input polynomials.[6]


I guess this combination of polynomial and tableau operations was something I never witnessed or read about. But on a very serious note I really feel its very important to use them.
ReplyDeleteTableau Rest Api Connection